Wildfire Simulation
Summer 2025
Wildfire Video Overview
In June 2025, I decided to compete in a US government challenge with the goal of taking Wildfire Simulation data stored in the QuicFire format and make a Virtual Reality (VR) simulation to replay the data in realtime. The aim is to ultimately use this VR simulation to aide in firefighter training. It should be realtime, and include as much of the different variables provided in the simulation data as possible. I had two months to submit my solution, and if I was in the top 10, I would get a chance to develop my solution further for one more month and present my work at the finals.
Sadly I did not win the competition, but I did make it to the finals and was able to compete with 7 companies and 2 academic groups. I was the only solo developer (to my knowledge) in the entire competition. Before June, I had never seen QuicFire before, nor have I ever worked in the firefighter world.
This challenge was a wonderful experience, and I met some incredibly kind and interesting people during the competition. I special shout out to Dr. Anil Shende for bringing this challenge to my attention and giving me purpose during the summer.
Below you will get insight into how I approached this competition, the MANY pitfalls and issues I had to overcome, and general musings on the development process. I do not claim to be an expert in Unreal Engine, Scientific Simulations, or programming in general. There is probably a dozen different (and better) ways to solve the challenges I mention below. However, I do believe sharing my experience can help others to understand how I work and provide a written record on what has been tried for future attempts.
Competition Outline
Requirements
- Read in QuicFire format data and visualize the data in real time on a VR headset
- Provide multiple viewing angles (i.e. First Person, Top down view, Drone view, etc)
- Allow the user to explore the virtual environment
Presentation with the following:
- General description
- Capabilities
- Potential expansions
- Potential barriers
- Next Steps
- A Video demonstrating your solution, including an explanation of how your solution works
Nice to Haves
- A solution to works solely off of a VR headset, requiring no additional compute or tether
- Allow for additional modes of visualizing the data, including phones and computers
- Allow the user to change variables in the simulation that affect the overall simulation. Such as changing wind direction, fuels, etc.
Timeline
The initial development was 2 months, and if you were selected in the top 10 teams, you are given ~1 month of additional development before you present your demo to the judges in person.
The Journey
This section is written more as a stream of thought and written largely during the time of development, so if the written style is jarringly different, that is why.
Reading and Understanding the Data (1 - 2 weeks)
Problem:
I have never looked at QuicFire data before, so trying to understand the data and learning how to read it was my main concern. Additionally, There is over a TB of data, so storing the data on my computer was another issue.
Goal:
Compress the data to a lossless format and understand the data well enough that I prepare Terrain, Trees, and a basic version of the fire data to later import into a game engine for realtime simulation.
Solution:
I developed a custom compression format that stores deltas between frames of data over each timestep, drastically reducing the memory footprint for a majority of the data used in QuicFire. For the terrain, I convert the terrain data to a heightmap format for later reading into the game Engine. For the tree data, I simply converted the tree list file provided into a csv for easy reading later.
Process / Stream of Thought:
Excited to get started, I eagerly started downloading the inputs and outputs from the repository offered by SERDP. However, I quickly realized two things:
1. There sure is a lot of different data points
2. Do those zip files say OVER 70GBs????? That is compressed?!?!?
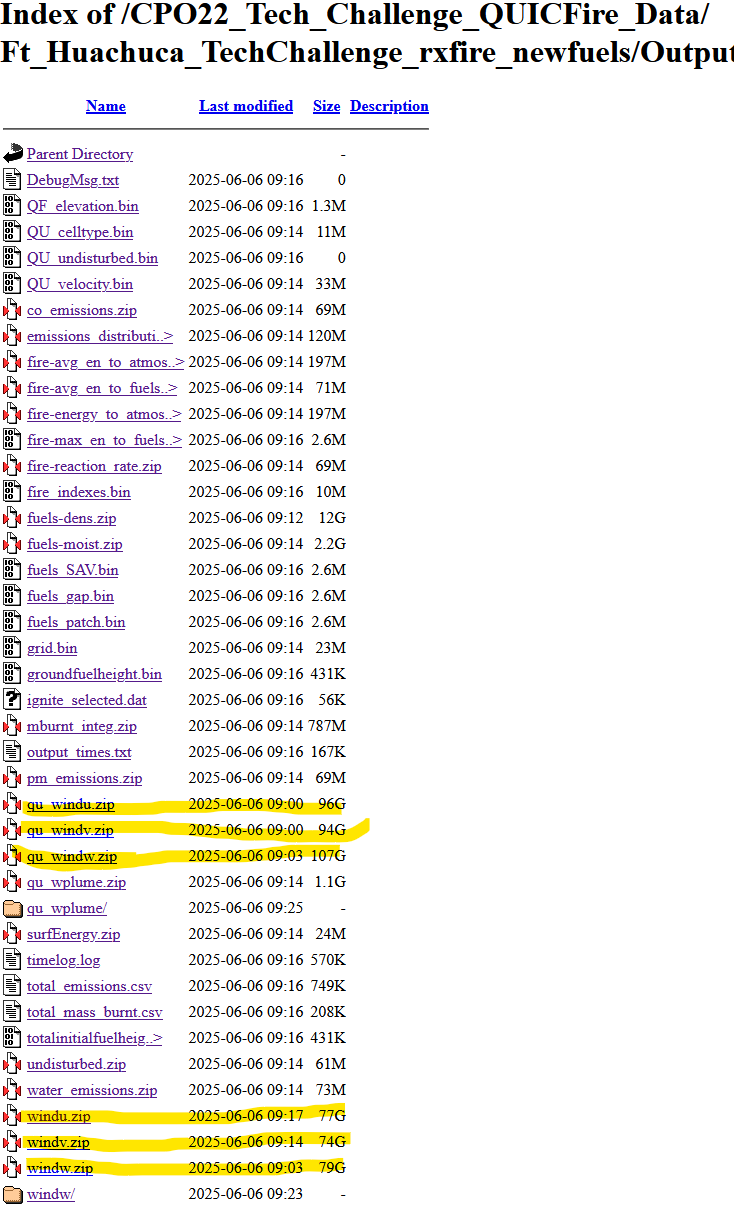
It was early on and I was already very concerned that not only was I not going to be able to run this data on a stand alone VR headset, I was not going to be able to fit it on my computer to even read it. After my initial panic, I noticed all of the really big files are wind, so I will just ignore wind for now and focus on the other variables with smaller data files. Let's start with one of the fire data variables, such as the "fire-avg_en_to_atmos" that was a modest 197MB zip file. Here is what the zip files unzips to:
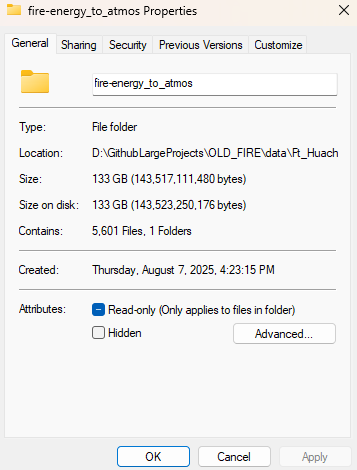
EXCUSE ME, WHAT? 133GB?
Yup, that is correct. This one variable in the fire simulation is 133GB over 5600 files. At this point I am thinking there is no way anyone is going to get anything running in a 3D simulation with these file sizes. But then i looked at the zip file size again. If that was 197MB, and unpacks to 133GB, there is surely a TON of redundant data we can remove while still maintaining the accuracy of the data. This led to me thinking about streaming videos.
Video Streaming is complicated, but I remember one technique that is often used is to capture "delta" frames. Essentially, instead of capturing every frame of a video and sending that data, we can make the assumption that the difference between two frames is small and therefore we send only the changes made between the previous frame and the current frame to reduce the total data needed. This is crucial for streaming providers to save on streaming data costs. This technique doesn't always work, especially if every value changes from one frame to the next, but in our case, this could save a lot of space.
However, these deltas cause a new problem: If you only save the first frame of video and the rest are deltas, then to reconstruct the i-th frame of the video, you have to have applied all the delta frames, in order, against the original 0-th frame. This is not a problem if you are monotonically moving forward in the video from start to finish, but if you wanted to jump to a random frame or move backwards, you are still forced to calculate all of those frames, instead of simply loading the frame you want. Essentially, we have made loading a random frame n a O(n) operation instead of a O(1) operation. Not the worst, but when you need to perform difference operations are a 1080p image, you can see how this starts to become an expensive operation to perform up to n times. We can improve this by periodically storing true frames (not deltas) periodically throughout our video. Now, when we land on a frame of the video that is a delta, we only need to calculate from our nearest true frame instead of from the 0-th frame. As a bonus, if we for some reason were accumulating errors as we calculate the deltas (something that can happen for floats), we can reduce that accumulation greatly and even check our error rate by periodically using true frames as grounding points. These extra true frames will increase our overall size since they do have potentially redundant data, but now we can control the percentage of true frames to deltas. This then allows us to adjust the balance of space savings gained from using delta frames versus the greater processing required to jump to a random frame of our video.
Here is a rough pseudo code of that:
true_data = load_video()
total_frames = len(true_data)

percent_of_true_frames_to_keep = 0.01 # 1% of true frames
interval_for_true_frame = max(1, floor(total_frames * percent_of_true_frames_to_keep))

saved_frames = [true_data[0]] # save the first frame as a true frame
prev_frame = true_data[0]
for frame_num in range(1, total_frames): # starting at 1 since we saved the first frame
cur_frame = true_data[frame_num]
if frame_num % interval_for_true_frame == 0:
	# we are through enough 1% of the data, so we save this frame as a true frame
	saved_frames.append(cur_frame)
	prev_frame = cur_frame
else:
	# we are not at true frame interval, so let's only save the delta
	diff_mask = cur_frame != prev_frame
	if np.any(diff_mask):
		# there are some differences between the current and previous frames,
		# we will save only the differences
		indices = np.argwhere(diff_mask)
		values = cur_frame[diff_mask]
	else:
		# there are no differences, so we will save an empty numpy array
		indices = np.empty((0, 3), dtype=int)
            values = np.empty((0,), dtype=cur_frame.dtype)
	saved_frames.append((indices, values))
	prev_frame = cur_frame
Keep in mind when loading from "saved_frames", you would now need to handle reading both delta frames and calculating the differences, as well as the true frames.
That is great and all, but what the heck does this have to do with fire simulations?
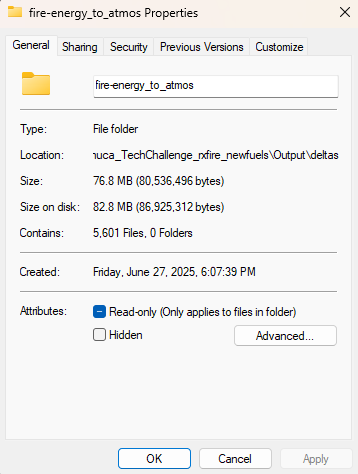
We can apply the same delta method to our fire data since this fire simulation is split up into time steps. Those 5600 files we unzipped? Each one of those is a time step. So this simulation is a lot like a video, just with a different scale. So we can apply the above method and reduce "fire-avg_en_to_atmos"'s 133GB worth of files down to a whopping 77MB!!!!
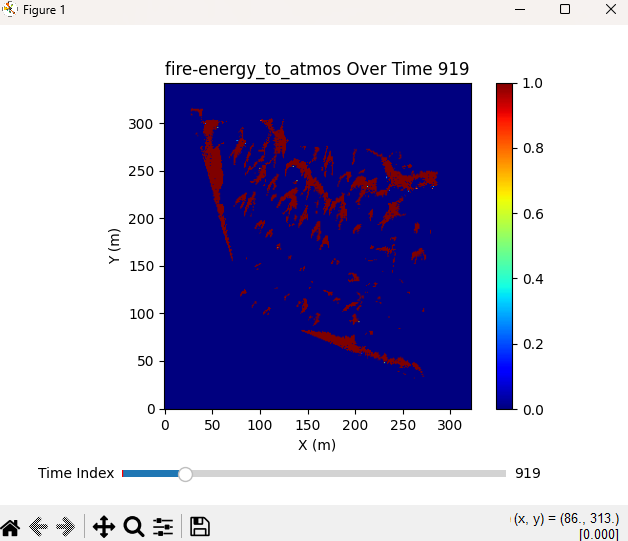
And since we have this video-like format, we can generate matplotlib graphs that can scrub through all the timesteps in real-time without needing to hold every timestep data in memory, since we are calculating the deltas on the fly. It is not as fast as simply loading the true frames, but the space we are saving on our computer is too great to pass up.
It is important to note that, while this method saved 132GB of space for "fire-avg_en_to_atmos", this does not guarantee that we will have the same savings for every single variable. The wind data had very large zip files, implying that there is much less redundant data that can be compressed. However, this should help for the smaller zip files to at least get it on our computer to study and play around with.
Great, now I can load files on my computer and visualize them. Now what?
Next was spending time researching what the heck most of this data means. My background is not in fire simulations, let alone fire fighting, so a lot of this is new to me. This involved a lot of time spent googling this data, as well as trying to decipher the provided Inputs and Outputs documents. Those documents might make sense to someone already familiar with QuicFire data, but to someone new to this domain, they are hard to understand. This is not made easier by the fact that many of the names used are the Fortran names used inside the Fortran code that creates the QuicFire simulation data. Since I don't have access to that QuicFire code, those names mean little to me.
However, not all hope was lost! More research lead me to a quicfire-tools repo for python. This tool validates reading all the QuicFire data, which saves me a lot of work trying to do that myself! The repo also includes a very useful Reference Guide explaining a tiny bit more detail about the Inputs and Outputs of QuicFire. It helped explain the Inputs and Outputs, but I still didn't understand how to create my own outputs. The data provided in the competition included both inputs and outputs, but if I wanted to be able to allow the user to be able to manipulate the simulation, I would need to be able to generate my own QuicFire data. Googling online did not help me find where the source code was. It was this reference guide that also helped me understand a crucial piece of QuicFire:
Specifically, the last sentence states "Running a simulation and understanding the relevant inputs are the responsibility of the user". So even this tool did not provide the QuicFire tool. And after contacting some of the organizers, I realized QuicFire was not openly available to the public. So that means any real-time modifications of the QuicFire data are not possible for my simulation. Oh well, let's move on to trees, an important part of the simulation.
Tree Data
As I was exploring the data, I noticed there was a file called "final_treelist2.txt" which, upon opening, has some promising data that I presume has something to do with tree data. I say presume because the data isn't labeled, but does appear to be similar to a CSV:
1	288.26	14.55	12.5	5.0	4.47	7.12	0.4	1.0	0.0005
1	291.02	13.74	4.27	2.35	4.26	3.41	0.4	1.0	0.0005
1	289.3	6.35	1.22	0.12	4.22	0.73	0.4	1.0	0.0005
1	290.96	4.25	1.22	0.12	4.22	0.73	0.4	1.0	0.0005
1	289.71	4.58	3.96	2.38	5.46	3.26	0.4	1.0	0.0005
1	291.32	0.84	4.27	2.35	4.26	3.41	0.4	1.0	0.0005
...
Doing some digging online, it appears it is related to FastFuels (another data tool/format used to represent fuel, such as trees). I found this repo that explains the format of the file, and it seems to be correct based on what I eventually import into my simulation. Here is what the data represents:
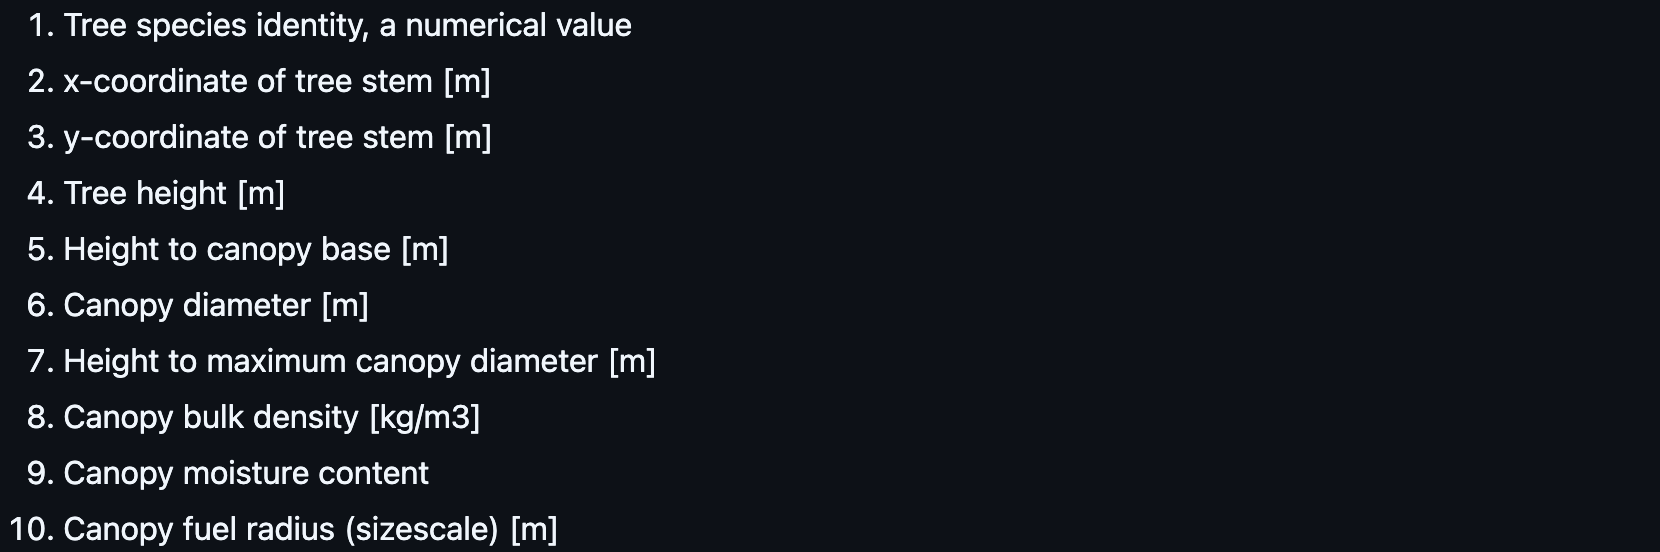
I can use the X and Y coordinates to place the trees, and the Canopy Diameter and Tree Height to scale the tree. So, i added columns to the data based on the info above and now I have a nice CSV I can use for future tree generation:
,TreeID,X,Y,TreeHeight,HeightToCanopyBase,CanopyDiameter,HeightToMaxCanopyDiameter,CanopyBulkDensity,CanopyMoistureContent,CanopyFuelRadius
0,1.0,288.26,14.55,12.5,5.0,4.47,7.12,0.4,1.0,0.0005
1,1.0,291.02,13.74,4.27,2.35,4.26,3.41,0.4,1.0,0.0005
2,1.0,289.3,6.35,1.22,0.12,4.22,0.73,0.4,1.0,0.0005
3,1.0,290.96,4.25,1.22,0.12,4.22,0.73,0.4,1.0,0.0005
4,1.0,289.71,4.58,3.96,2.38,5.46,3.26,0.4,1.0,0.0005
...
Now to figure out Terrain!
Terrain
Now that I have trees, I need to figure out terrain. - QU_TopoInputs.inp - remove the hard reference to the usgs_dem.dat file - Trying to verify the data by looking up Lat Long - dealing with Square heightmaps - dealing with Z scale
Creating a Fire Simulation in Unreal Engine (6 weeks)
Now that we have data, I figured I would start with terrain, as everything will build off of that. Importing Terrain is not terribly difficult in Unreal Engine if you already have a heightmap, so I was able to pretty easily import the heightmap I already made. However, I did run into the issue that Heightmaps in Unreal Engine have to be square. Annoying since our solution is not square (640m x 680m), but I decided to pad one edge of the terrain with 0s, and I would just have to align the rest of the simulation to the ignore the zeroed out part of the solution. Here is some of the settings I used for my particular terrain:
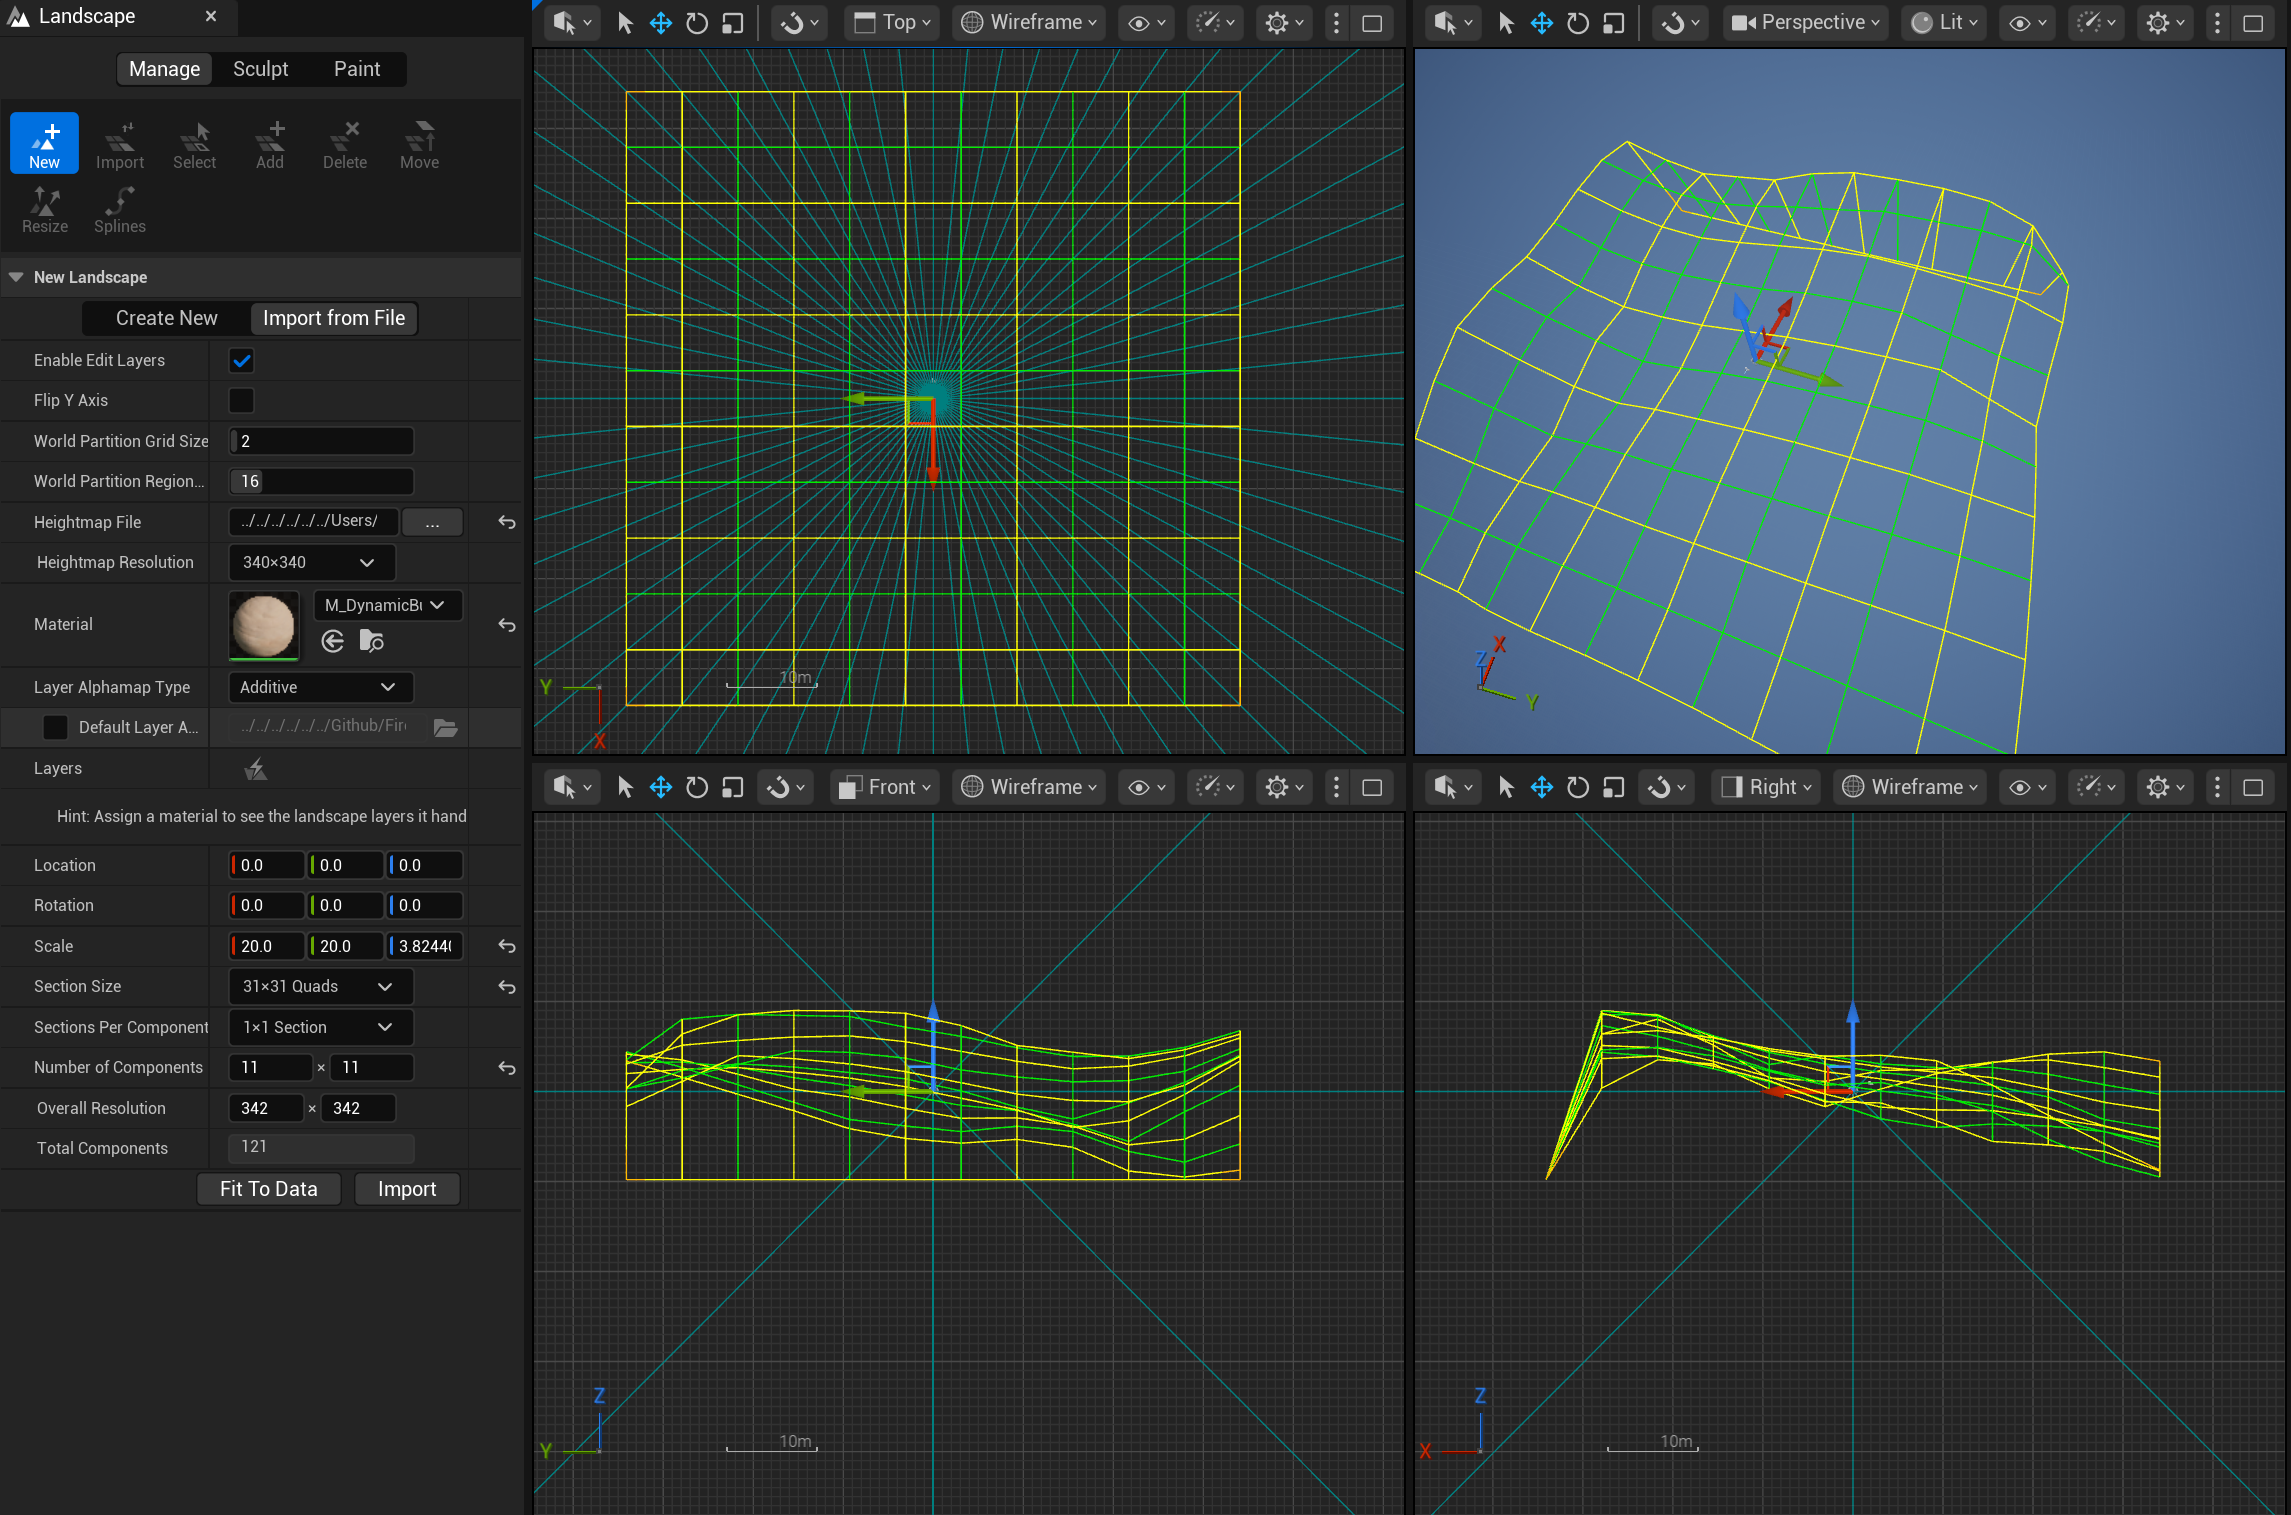
Coming Soon...
- Terrain Material Generation
- Importing and Generating 40k+ Trees
- Importing Fire Simulation
- Basics of the Minimap
- VR Woes